Programming/chart.js2024. 6. 27. 16:35

chart.js 에서 반응형 설정은 아래와 같은데

options : {
  responsive : true,
}

[링크 : https://www.chartjs.org/docs/latest/configuration/responsive.html]


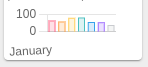
정작 이렇게 설정하고 보면 아래와 같이 나오는데
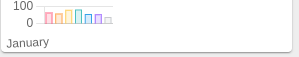
 

요걸 창 크기 줄여서 작게 만들고


다시 화면을 원래대로 키우면 그래프는 안커진다.


머라머라 써있는데 모르겠고

Important Note
Detecting when the canvas size changes can not be done directly from the canvas element. Chart.js uses its parent container to update the canvas render and display sizes. However, this method requires the container to be relatively positioned and dedicated to the chart canvas only. Responsiveness can then be achieved by setting relative values for the container size (example ):

<div class="chart-container" style="position: relative; height:40vh; width:80vw">
    <canvas id="chart"></canvas>
</div>
 
        Copied!
    
The chart can also be programmatically resized by modifying the container size:

chart.canvas.parentNode.style.height = '128px';
chart.canvas.parentNode.style.width = '128px';
 
        Copied!
    
Note that in order for the above code to correctly resize the chart height, the maintainAspectRatio option must also be set to false.

[링크 : https://www.chartjs.org/docs/latest/configuration/responsive.html#important-note]


responsive : true 하고

창의 최소 높이(css min-height)를 지정하면 그정도 까진 사단이 안난다는 의미인 듯.

[링크 : https://stackoverflow.com/questions/55545191/]

'Programming > chart.js' 카테고리의 다른 글

chart.js multi y axis  (0) 2023.09.27
chart.js 특정 항목 보이지 않게 하기(가로줄 치기)  (0) 2023.03.10
chart.js 수직 도움선  (0) 2023.01.27
Posted by 구차니
Programming/chart.js2023. 9. 27. 11:12

엑셀이나 오픈오피스(리브레오피스) calc 에서 그래프 그릴때 많이 사용하는 다축 그래프


생각외로 어렵진 않은데, 런타임중에(초기화 이후) 변경이 가능한진 모르겠다

const config = {
  type: 'line',
  data: data,
  options: {
    responsive: true,
    interaction: {
      mode: 'index',
      intersect: false,
    },
    stacked: false,
    plugins: {
      title: {
        display: true,
        text: 'Chart.js Line Chart - Multi Axis'
      }
    },
    scales: {
      y: {
        type: 'linear',
        display: true,
        position: 'left',
      },
      y1: {
        type: 'linear',
        display: true,
        position: 'right',

        // grid line settings
        grid: {
          drawOnChartArea: false, // only want the grid lines for one axis to show up
        },
      },
    }
  },
};

const DATA_COUNT = 7;
const NUMBER_CFG = {count: DATA_COUNT, min: -100, max: 100};

const labels = Utils.months({count: 7});
const data = {
  labels: labels,
  datasets: [
    {
      label: 'Dataset 1',
      data: Utils.numbers(NUMBER_CFG),
      borderColor: Utils.CHART_COLORS.red,
      backgroundColor: Utils.transparentize(Utils.CHART_COLORS.red, 0.5),
      yAxisID: 'y',
    },
    {
      label: 'Dataset 2',
      data: Utils.numbers(NUMBER_CFG),
      borderColor: Utils.CHART_COLORS.blue,
      backgroundColor: Utils.transparentize(Utils.CHART_COLORS.blue, 0.5),
      yAxisID: 'y1',
    }
  ]
};

[링크 : https://www.chartjs.org/docs/latest/samples/line/multi-axis.html]

Posted by 구차니
Programming/chart.js2023. 3. 10. 16:23

클릭하면 당연히(?) 줄 그어져서 죽는데

코드로 처음부터 해당 항목을 hidden 상태로 표시하려니 먼가 묘하게 어렵다?


function(e, legendItem, legend) {
    const index = legendItem.datasetIndex;
    const ci = legend.chart;
    if (ci.isDatasetVisible(index)) {
        ci.hide(index);
        legendItem.hidden = true;
    } else {
        ci.show(index);
        legendItem.hidden = false;
    }
}

[링크 : https://www.chartjs.org/docs/latest/configuration/legend.html]


매우 귀찮으니(!)

chart 라는 변수에 chart.js 객체가 존재한다면

아래의 legned.chart.hide(index) 로 끄고 legned.chart.show(index) 로 표시할 수 있다.

index 이니 0부터 시작함에 주의!

//var chart = new chart()
chart.legend.chart.hide(1)
chart.legend.chart.show(1)

'Programming > chart.js' 카테고리의 다른 글

chart.js 반응형 설정시 작아지는데 안커지는 문제  (0) 2024.06.27
chart.js multi y axis  (0) 2023.09.27
chart.js 수직 도움선  (0) 2023.01.27
Posted by 구차니
Programming/chart.js2023. 1. 27. 14:28

chart.js의 interaction 항목을 intersect = false로 해주면


var chart_obj = new Chart(chart, {
plugins: [{
afterDraw: chart => {
  if (chart.tooltip?._active?.length)
  {               
 let x = chart.tooltip._active[0].element.x;             
 let yAxis = chart.scales.y;
 let ctx = chart.ctx;
 ctx.save();
 ctx.beginPath();
 ctx.moveTo(x, yAxis.top);
 ctx.lineTo(x, yAxis.bottom);
 ctx.lineWidth = 1;
 ctx.strokeStyle = 'rgba(0, 0, 255, 0.4)';
 ctx.stroke();
 ctx.restore();
  }
}
  }],

// ...

options: {
animation : false,
interaction: {
            intersect: false,
            mode: 'index',
          },
spanGaps: true
}

[링크 : https://stackoverflow.com/questions/68058199/chartjs-need-help-on-drawing-a-vertical-line-when-hovering-cursor]


options.interaction.mode
nearest - 근접한 위치의 포인트를 툴팁으로 표시 (기본값)
index - 여러개의 데이터가 있을 경우 모아서 툴팁으로 표시

optiones.interaction.intersect
true - 선에 겹쳐야만 툴팁 표시
false - 해당되는 x 축에 대해서 툴팁 표시

[링크 : https://www.chartjs.org/docs/latest/configuration/interactions.html]

Posted by 구차니